Note
Click here to download the full example code
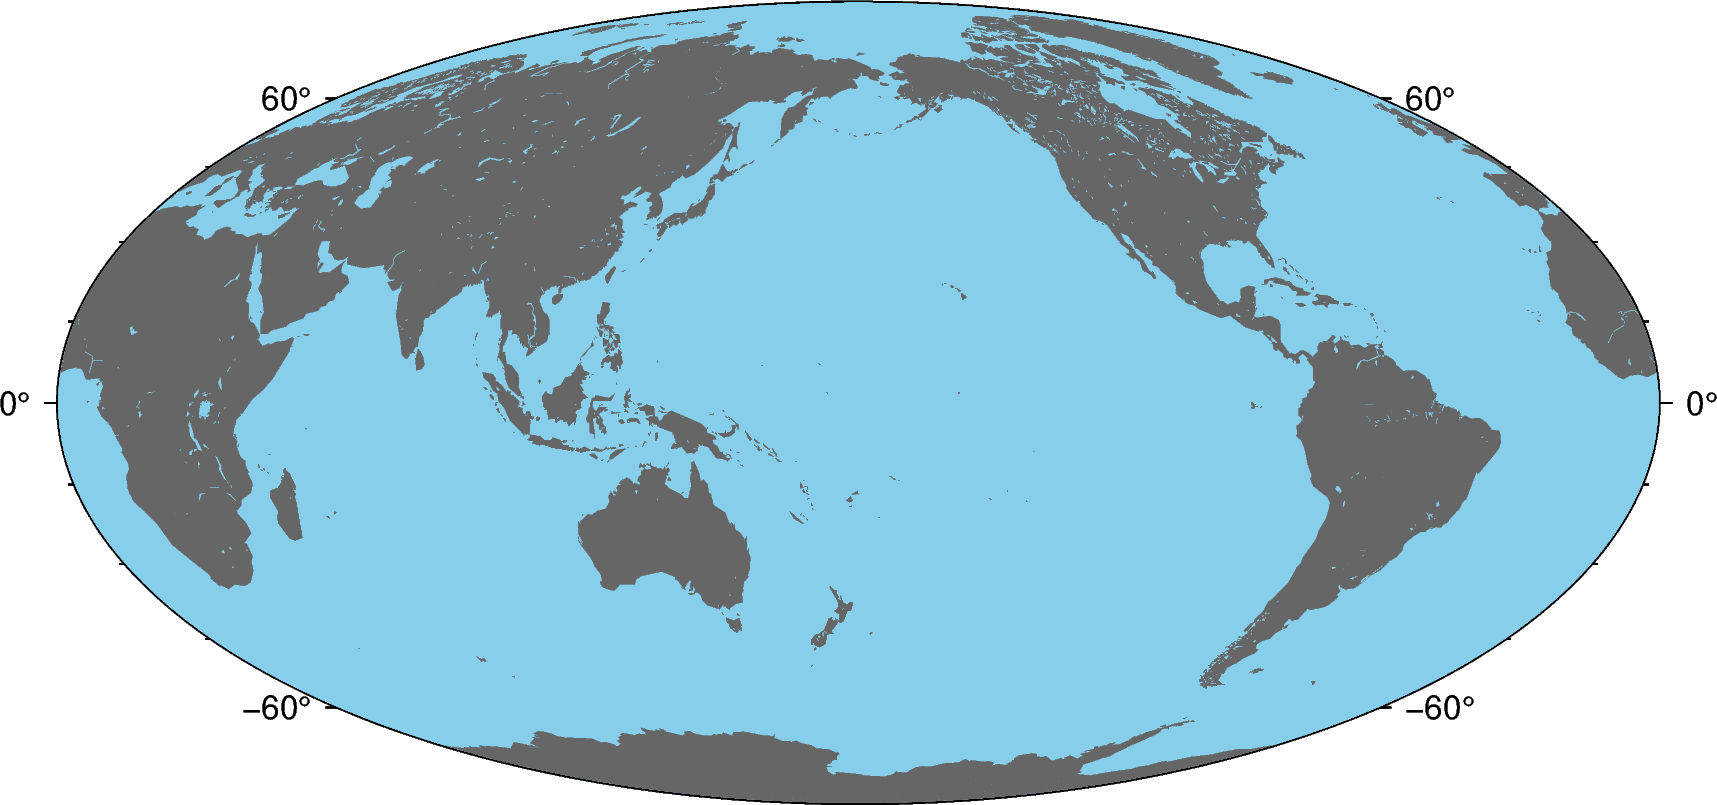
Color land and water
The land and water arguments of pygmt.Figure.coast specify a color to
fill in the land and water masses, respectively. You can use standard GMT color names or
give a hex value (like #333333).
Out:
<IPython.core.display.Image object>
import pygmt

fig = pygmt.Figure()
# Make a global Mollweide map with automatic ticks
fig.basemap(region="g", projection="W8i", frame=True)
# Plot the land as light gray
fig.coast(land="#666666", water="skyblue")
fig.show()
Total running time of the script: ( 0 minutes 1.026 seconds)